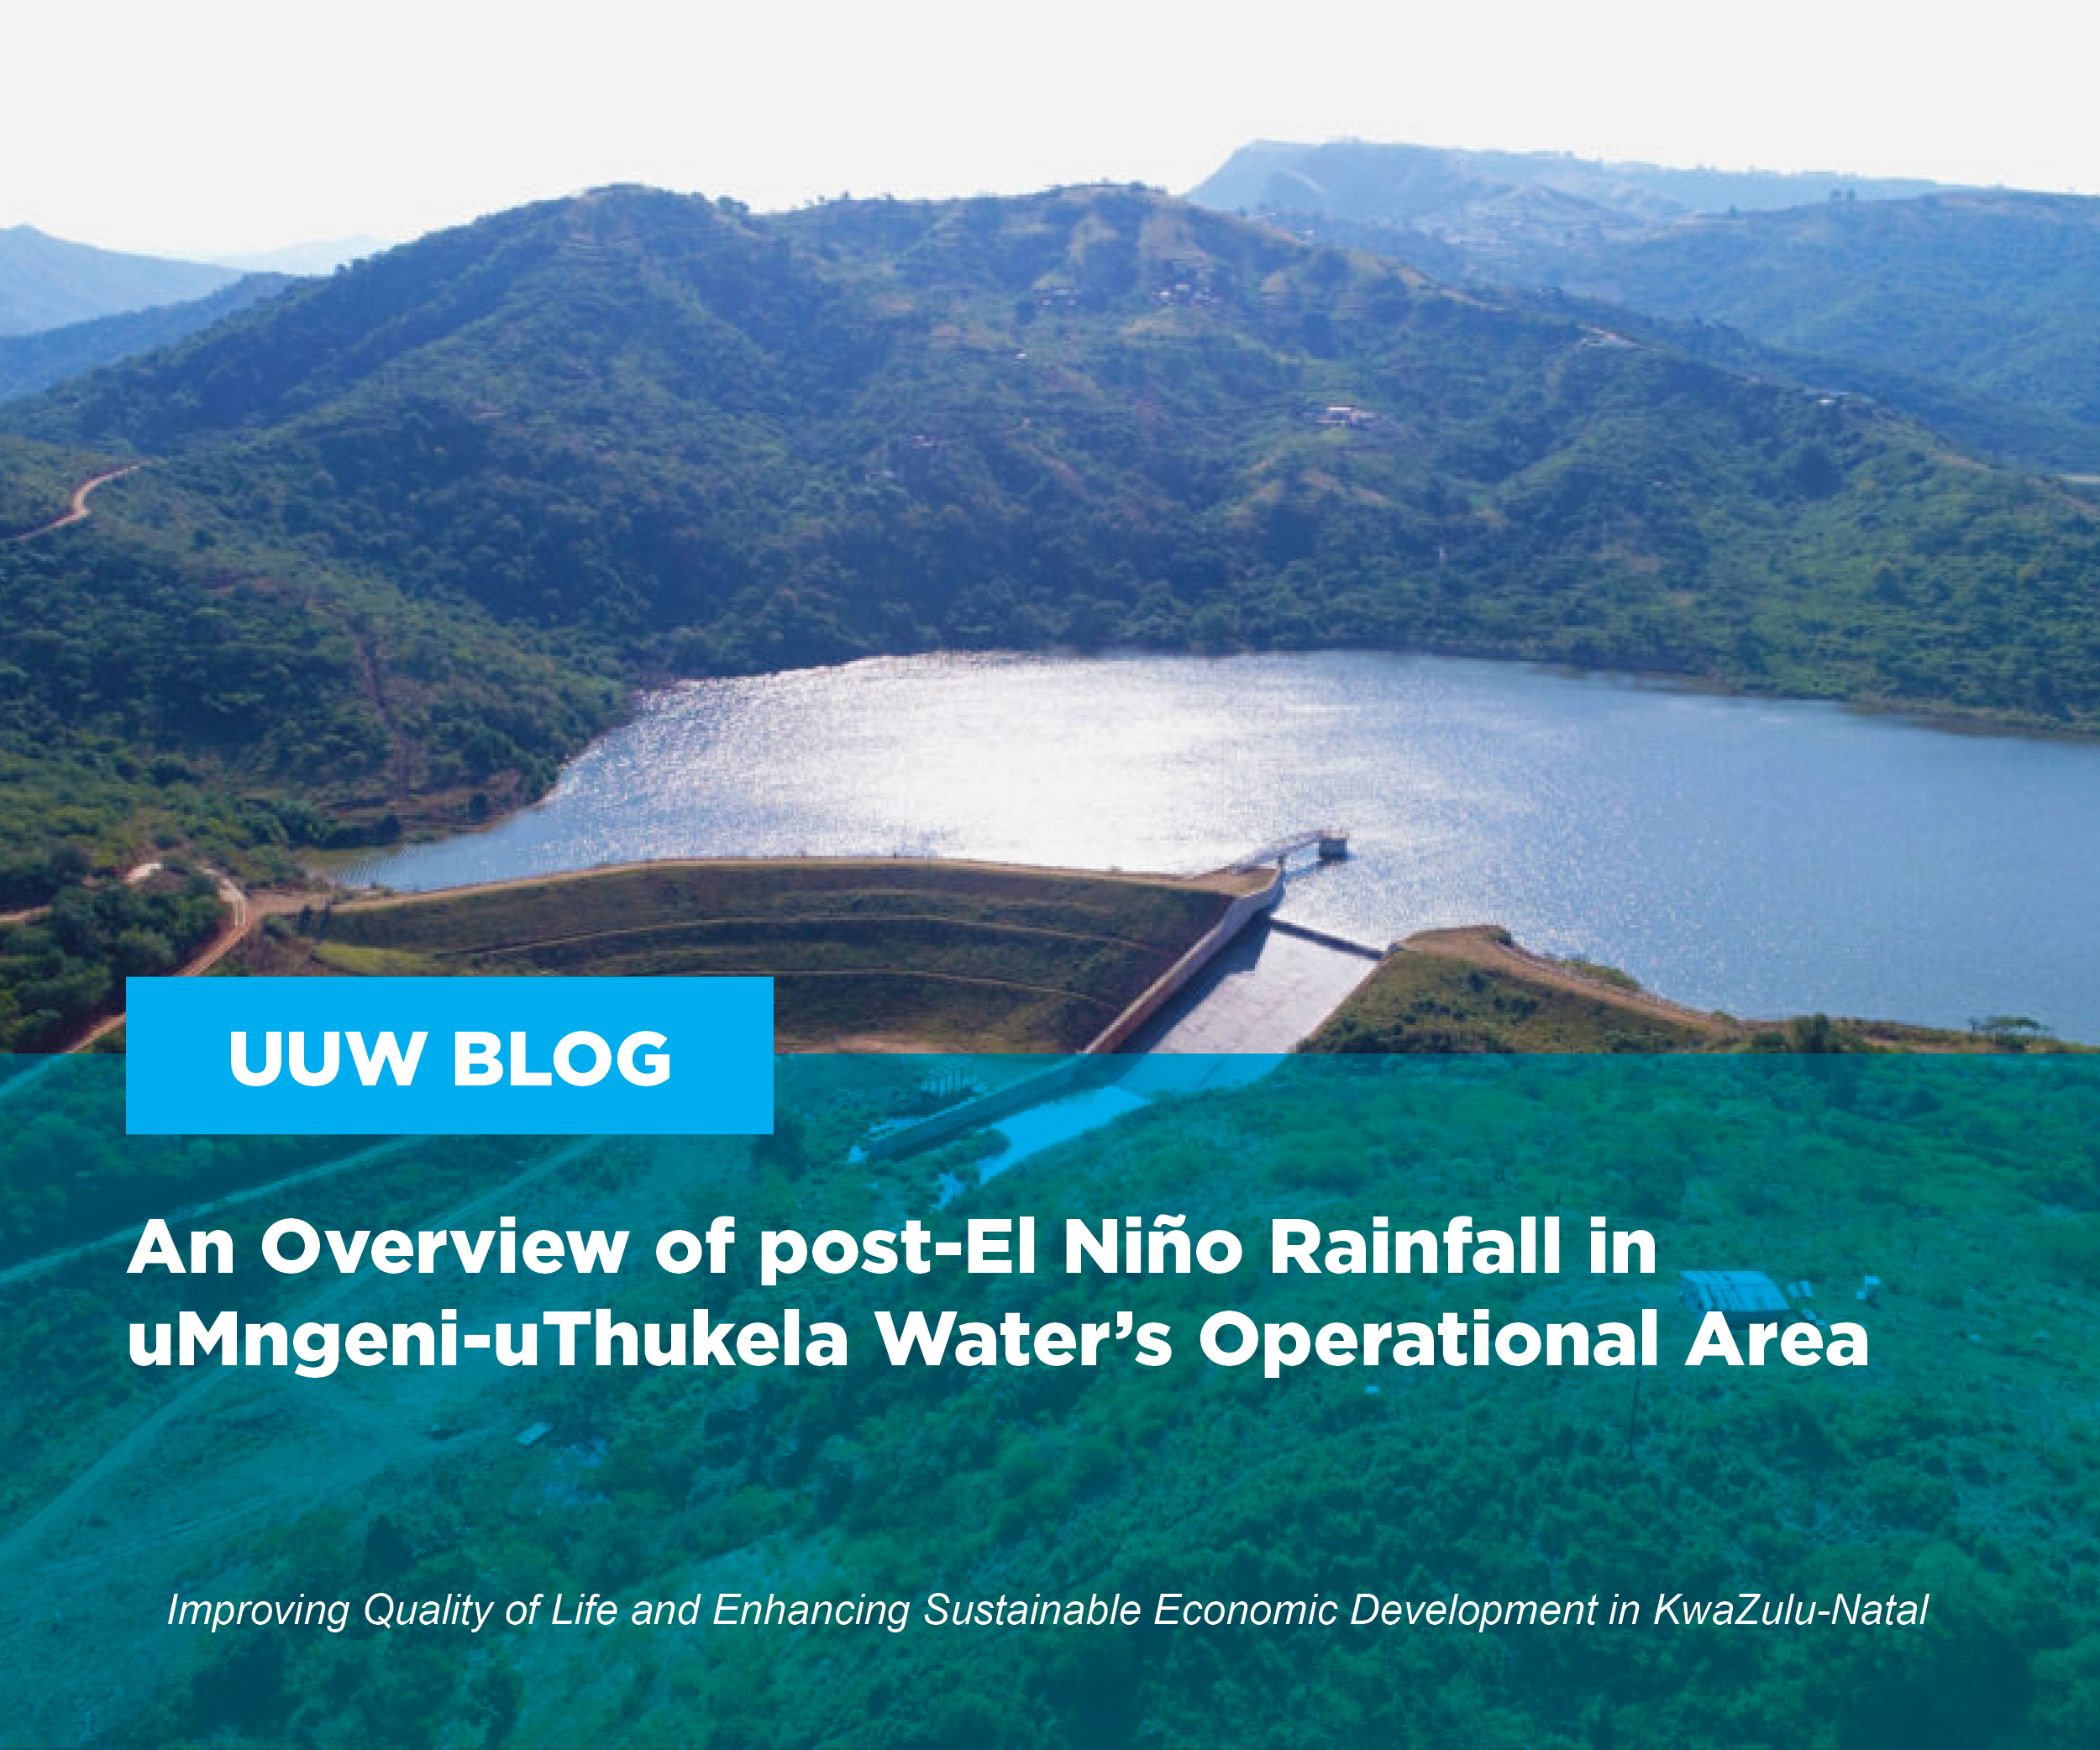
By Mlungisi Shabalala, 03 December 2025
The 2024/25 rainfall season followed the 2023/24 El Niño cycle. In Southern Africa, El Niño cycles are associated with hot and dry climatic conditions. The 2023/24 El Niño cycle, which ended in June 2024, had minimal impacts on water resources availability in UUW’s operational area. However, the effects of El Niño can extend beyond the declaration of a non- El Niño state (i.e. neutral or La Niña). Therefore, it is important to closely monitor rainfall and dam levels following an El Niño event. This article presents a summary of the post- El Niño rainfall in uMngeni-uThukela Water’s operational area.
The upper uMngeni System (Midmar Dam) received below-average rainfall during the first five months of the rainfall season, except during November 2024, where the rainfall received was 78% above the long-term average. The middle (Albert Fall and Nagle Dam) and lower-uMngeni (Inanda Dam) regions generally received above-average rainfall throughout the rainfall season, except in December 2024, where the rainfall received was 60-80% below the long-term average. The highest rainfall was recorded in April 2025, with all dams in the uMngeni System receiving nearly 200% of the long-term average.
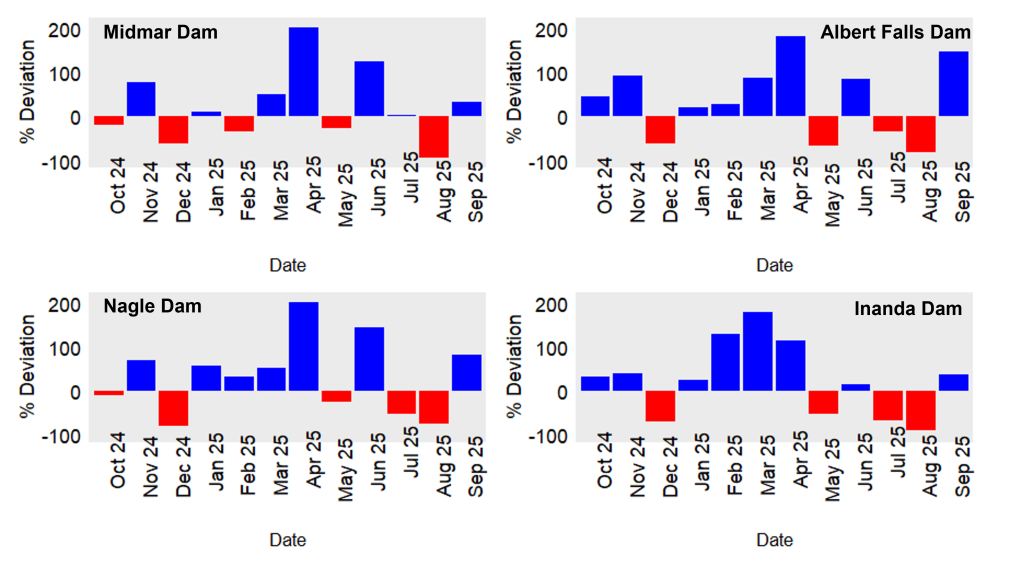
Figure 1: 2024/25 monthly rainfall for dams in the uMngeni System (shown as percentage deviation from the long-term average).
The Ixopo system, which is located towards the south coast, received below-average rainfall during the first four months of the rainfall season, except in November where the rainfall received was 100% above the long-term average. An increase in rainfall was observed during the latter parts of the rainfall season, with the peak rainfall being observed in April (i.e. 146% above-average). The Ixopo system received above-average rainfall throughout winter, which ensured that a high water resource status is maintained.

Figure 2: 2024/25 monthly rainfall for the Ixopo System (shown as percentage deviation from the long-term average).
The South Coast System, represented by Umzinto and Nungwane Dams, received above-average rainfall throughout the rainfall season, except during December, where the observed rainfall was 40% lower than the long-term average. February 2025 marked the peak of the rainfall season in the South Coast System, with the observed rainfall in Umzinto and Nungwane Dam being 251% and 194% above the long term-average rainfall, respectively. During April, the last month of the rainfall season, rainfall received in the South Coast System was 166% above the long-term average. This ensured that water resources are recharged before the winter season.
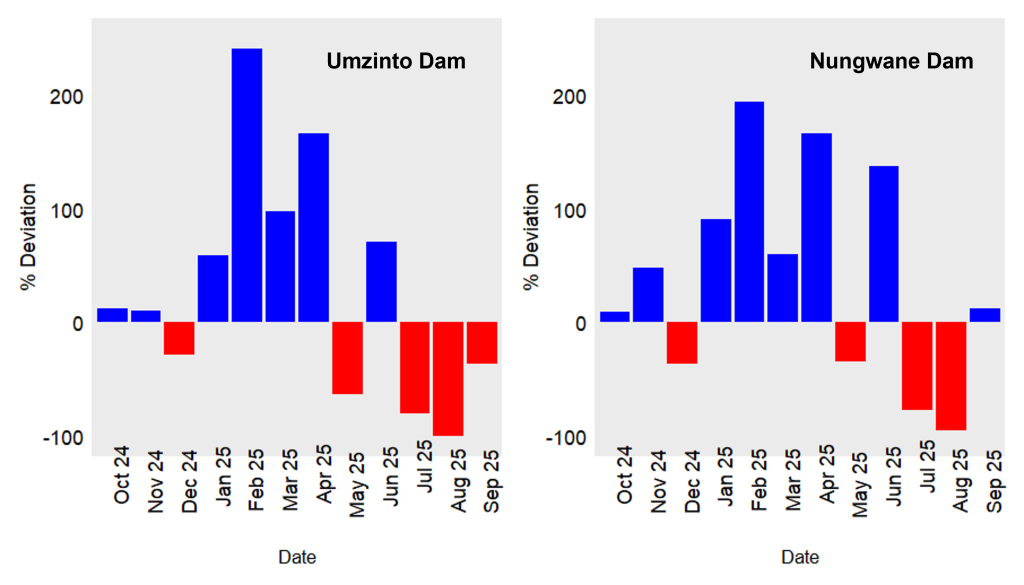
Figure 3: 2024/25 monthly rainfall for dams in the South Coast System (shown as percentage deviation from the long-term average).
The North Coast (represented by Hazelmere Dam) received above-average rainfall throughout the rainfall season, except during December 2024, where the observed rainfall was half of the long-term average. Peak rainfall was observed in March, where the observed rainfall was 245% above the long-term average.
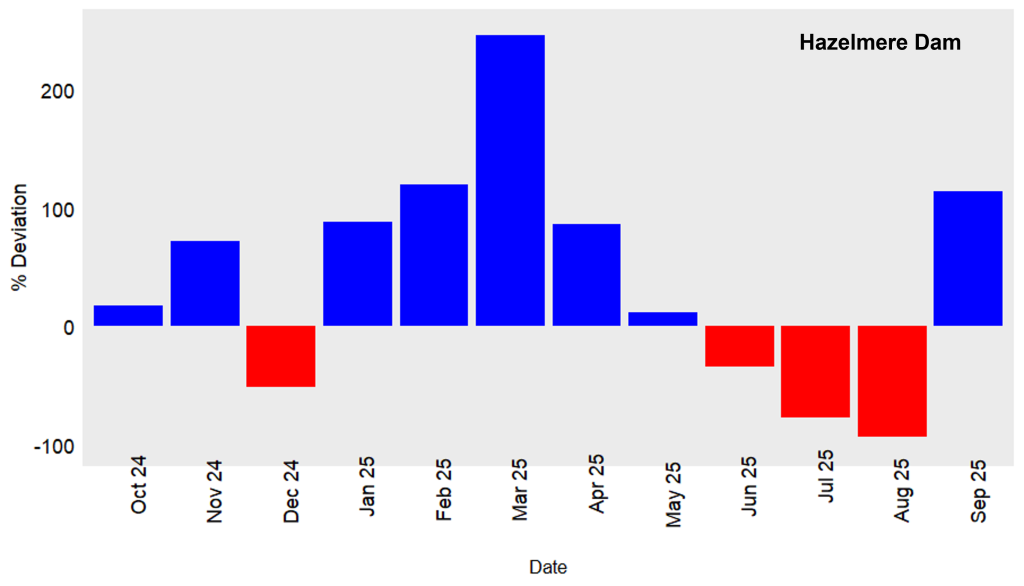
Figure 4: 2024/25 monthly rainfall for dams in the North Coast System (shown as percentage deviation from the long-term average).
The uMhlathuze System (represented by Eshowe and the Goedertrouw Dam) generally received above-average rainfall during the rainfall season, with higher rainfall being observed towards the coast (i.e. Eshowe). The interior, i.e. Goedertrouw Dam, received low rainfall during the earlier parts of the rainfall season, with the observed rainfall being 47% and 14% below the long-term average during November and December, respectively. The highest rainfall was recorded in April, with the Mhlathuze System receiving approximately 200% above-average rainfall.
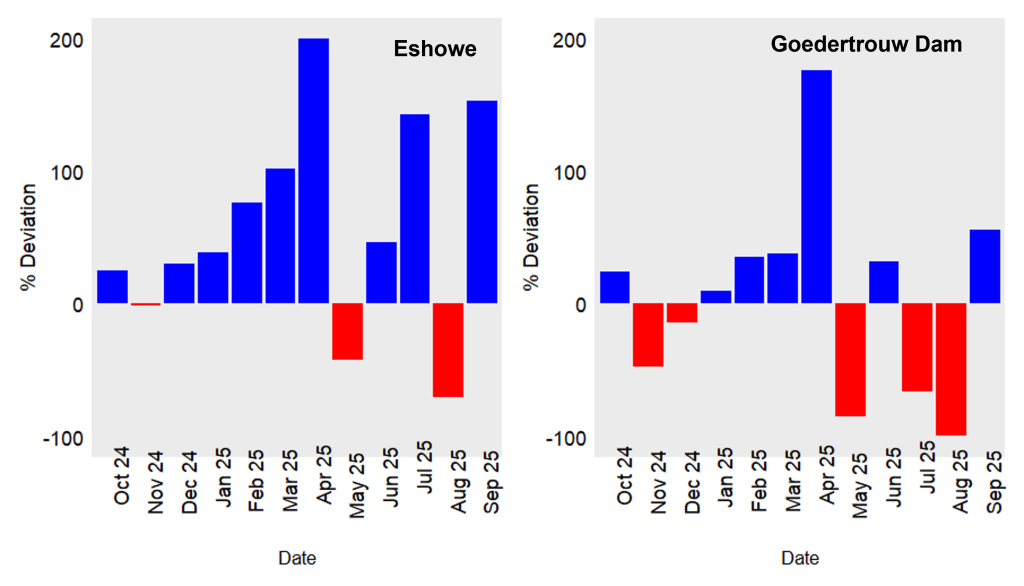
Figure 5: 2024/25 monthly rainfall for dams in the uMhlathuze System (shown as percentage deviation from the long-term average).
In the north-eastern parts of KwaZulu-Natal, the uPhongolo System received relatively normal rainfall for most parts of the rainfall season. The highest rainfall was received in April, where the observed rainfall was nearly 300% above the long-term average. This high rainfall resulted in the overflowing of the Pongolapoort Dam between 18th and 19th April 2025, which is a rare occurrence as the dam is managed at 80% of its full supply capacity due to safety reasons.

Figure 6: 2024/25 monthly rainfall for dams in the uPhongolo System (shown as percentage deviation from the long-term average).
uMngeni-uThukela Water’s operational area received above-average rainfall during the 2024/25 rainfall season. December 2024 recorded below-average rainfall throughout the KwaZulu-Natal province. The highest rainfall was observed during the latter parts of the rainfall season in all regions, which ensured the recharge of water resources infrastructure before the winter season. As a result, all UUW-operated dams remained at acceptable levels throughout the winter period.
According to climate models by the International Research Institute for Climate and Society (IRI), there is moderate likelihood for the development of a La Niña cycle during the 2025/26 summer season. La Niña cycles are associated with cool and wet weather conditions in Southern Africa. Therefore, it is important to monitor the ENSO signal as excessive rainfall may result in flooding. Although climate models predict above-average rainfall, water conservation remains essential as the demand exceeds available supply in most of UUW’s supply area. UUW will provide the next update at the end of January 2026.